
Top 2 Misconceptions for PES

Welcome back to our lost and found series where we cover the misconceptions that we as students faced and help them get back on the right track!
This week, we will be looking at PES!
How do we interpret the determinants?
In chapter 2, we learnt the reason why the Supply curve is upward-sloping:
Higher prices means that firms’ profits increase and so firms face an incentive to produce more output
When examining PES, which is essentially the responsiveness of the quantity of a good supplied to changes in its price, we are looking to see how well firms are able to change their Qs to meet changes in prices. In essence, another way to look at it is when price changes, how effectively can they change their Qs?
So, let’s say price of tennis balls increase. Firms would thus want to increase their Qs so that they can sell more. The determinants actually help us to examine whether they will be able to effectively respond or not.
For example, the greater the spare capacity that firms have, the higher the PES. WHY? For instance, a firm producing tennis balls and have a large number of unused tennis-ball making machines would be able to quickly use those machines should they need to increase production (Qs). Contrast this to a firm already producing using all its machines at max capacity so it won’t be able to increase production even if price increases.
2. Consequences of a Low PES For Primary Commodities
There are 2 consequences for producers of primary commodities.
Price instability
Income instability
How do we show this?
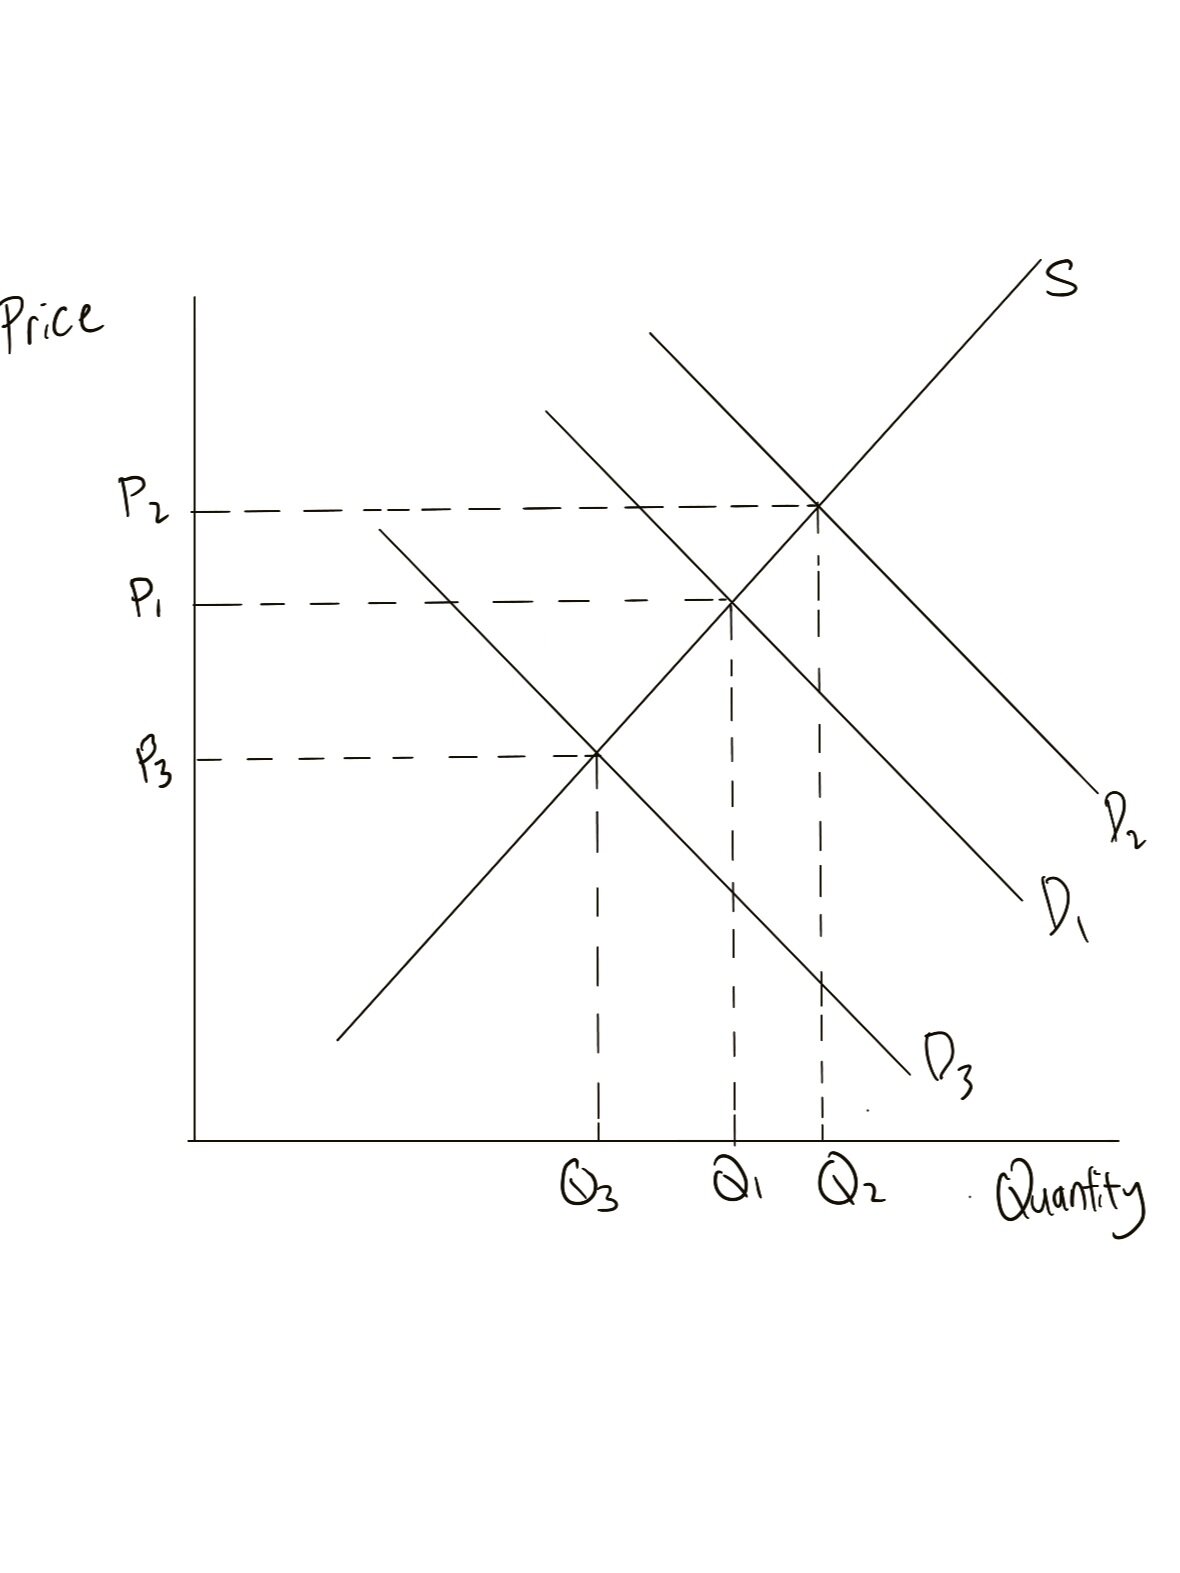
We start off by showing the supply curve that producers face, an inelastic one. This means that the supply curve would be steeper, as shown in the diagram above. Next, we show what happens when demand fluctuates, through the shifting of the Demand curves. As you may notice, the prices change drastically thus showing that the price that primary producers are able to receive can fluctuate relatively largely as well. This in turn affects the fluctuations of revenue as well.
But that’s not enough!
We then contrast this to the Supply curve faced by producers of manufacturing goods.

(Appologies for the crooked axis!) Here, we can see that despite the Demand curve possibly fluctuating more, prices do not change as much as compared to the prices for primary commodities. This means that producers of manufacturing goods do not face such huge price fluctuations and thus income as well.
That’s it for this week’s Lost and Found series! I hope this has been helpful and if you want to request any particular topic, please drop us an email at ibloungesg@gmail.com.
Alternatively, you may consider receiving help from our Economics tutor right here! They have both achieved a grade 7 in Economics as well as above 40 points for IB!